
🔬
PM sensor
Laser particle sensor for PM2.5 and PM10.
Examples: Plantower, Honeywell, Sensirion.
Sensors feed a controller, which computes the AQI and pushes data over the internet to a cloud server. From there it drives dashboards, alerts and the on-site LED display.
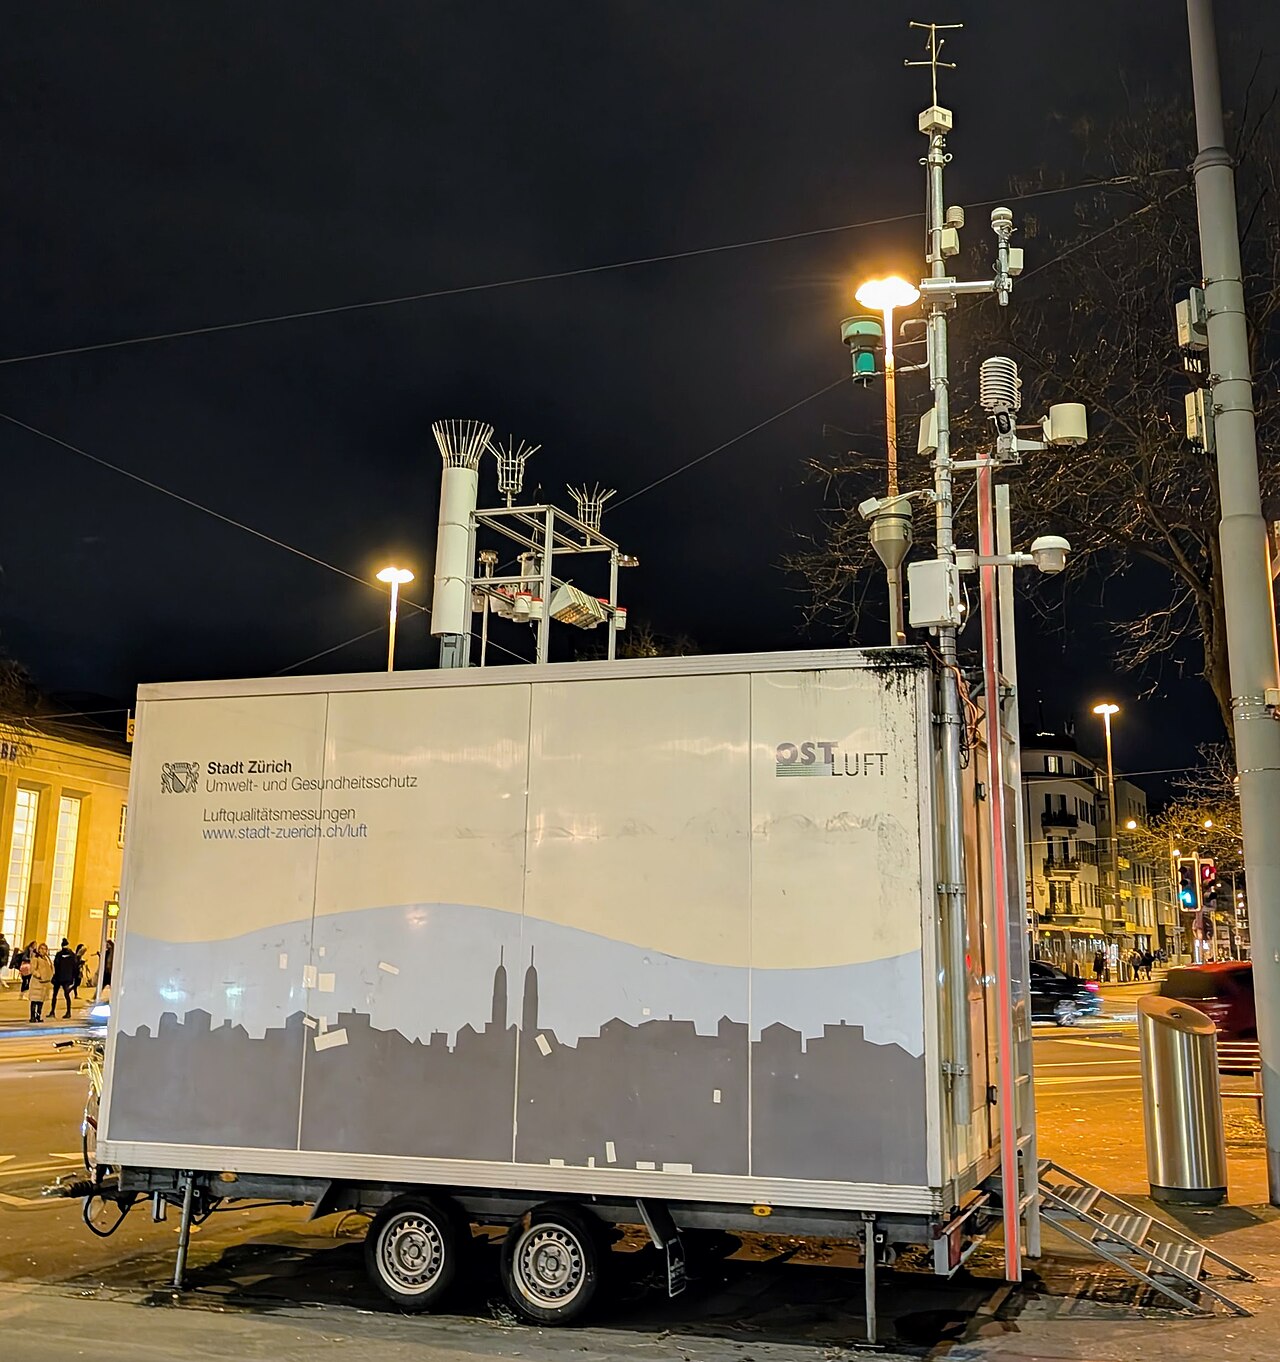 A real monitoring station: sensor mast + weatherproof cabinet
Dust, weather, noise
ESP32 / PLC / Pi
4G / Wi-Fi / LoRa
Store · compute · alert
Public readout
Laser particle sensor for PM2.5 and PM10.
Examples: Plantower, Honeywell, Sensirion.
Temperature, humidity, wind speed/direction and rain in one unit.
Outdoor microphone with weather protection for continuous dB monitoring.
Reads sensors and computes AQI.
Options: ESP32, Raspberry Pi, PLC, STM32, industrial IoT.
4G SIM, Wi-Fi, Ethernet, or LoRa for some deployments.
P10 LED, P6 LED, outdoor LCD, or high-brightness LED sized to the site.
PM sensors commonly use laser scattering. Air is drawn through the sensor; when dust passes the laser beam, light scatters onto a detector that counts particles and derives PM2.5 / PM10 values.
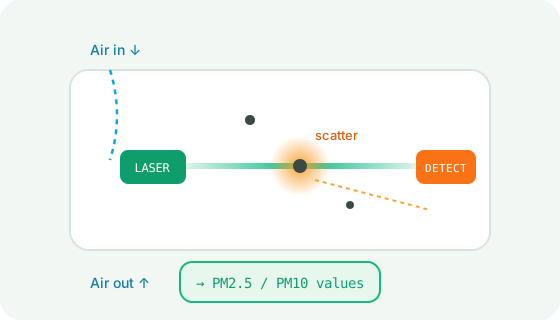
A small fan pulls surrounding air through the sensor chamber.
Particles cross a focused laser beam inside the chamber.
Each particle scatters light in proportion to its size.
A photodetector measures the scattered light pulses.
Counts are converted to PM2.5 and PM10 concentrations.
Each pollutant's concentration is converted to a sub-index using defined breakpoints. The worst (highest) sub-index becomes the overall AQI — so a single bad pollutant sets the reading.
Measure PM2.5, PM10 (and any gases) as 24-hour averages.
Interpolate each value between standard breakpoints (e.g. CPCB) to a 0–500 scale.
The maximum sub-index is the reported AQI, with its colour-coded category.
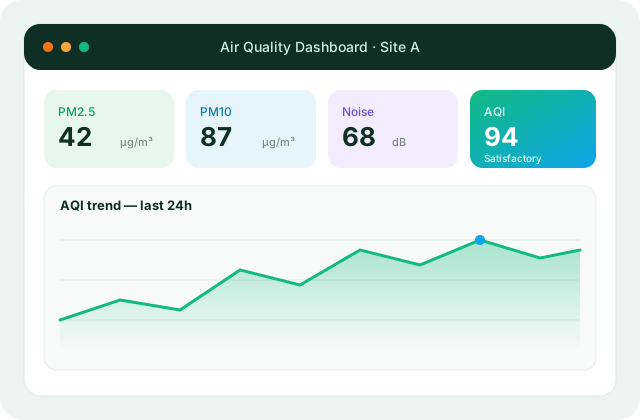
The system is more than a display — the software turns raw readings into reports, alerts and a compliance record.
Threshold breached
When PM crosses the configured threshold, the platform can automatically notify the team and change the board colour — prompting immediate action such as switching on water sprinklers or anti-smog guns.
Sensors, controller, connectivity, LED board and cloud dashboard — supplied, installed and calibrated as one package.