Large construction and demolition sites are increasingly required to run real-time dust monitoring and display air quality publicly. Here's the regulatory context in India, the AQI scale, a live calculator, and the official guideline documents.
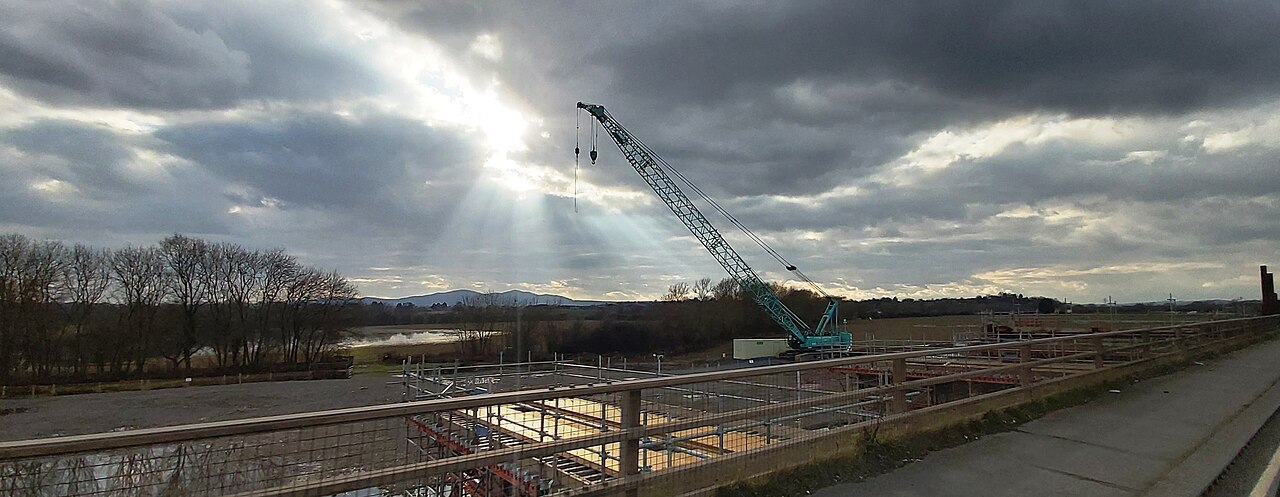 Large infrastructure projects face the strictest monitoring rules
Central and state bodies — the CPCB, the Commission for Air Quality Management (CAQM) and state pollution control committees such as the DPCC — have tightened rules on construction dust. Thresholds vary by state and region, so always confirm what applies to your project.
In Delhi, C&D projects of 500 m² or more must register on the DPCC dust portal and run continuous PM2.5/PM10 monitoring, with live CCTV feeds for remote surveillance.
Large sites (commonly cited above 20,000 m²) are required to install a mandatory LED display board showing real-time air quality on site.
Water sprinkling, green netting, wheel washing, tarpaulin-covered trucks, and anti-smog guns sized to the site's built-up area.
An Environmental Management Plan is mandatory for larger projects, with periodic self-audit assessment submissions.
Systems can be calibrated to alert and push data to pollution control boards when dust exceeds permissible limits.
A community complaint register is to be maintained and displayed, with dust-control measures logged.
AQI converts pollutant concentrations into one number across six categories. The overall AQI equals the worst pollutant sub-index. Sub-indices are defined for eight pollutants (PM10, PM2.5, NO₂, SO₂, CO, O₃, NH₃, Pb).
Category naming varies between standards (some label 51–100 "Moderate"). Values follow India's CPCB National AQI.
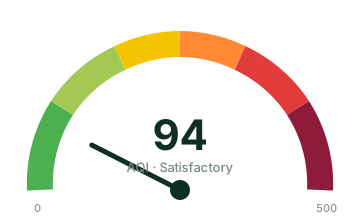
Enter PM2.5 and PM10 concentrations to see the resulting AQI and category (worst sub-index wins), using CPCB breakpoints.
Each pollutant is mapped to a 0–500 sub-index by linear interpolation between its breakpoints. The overall AQI is the higher of the two, and its band decides the colour and label. Real deployments use 24-hour averages and additional pollutants.
Primary Indian regulatory references — download the PDFs or open the official portals.
Delhi guidelines for monitoring dust mitigation at construction & demolition sites.
Direction on dust-control measures and anti-smog guns in C&D projects.
Guidance on ambient air-quality monitoring methods and siting.
The live National AQI portal, breakpoints and methodology.
We'll help you match sensors, display size and reporting to the rules for your location and project size — and keep the data audit-ready.
